
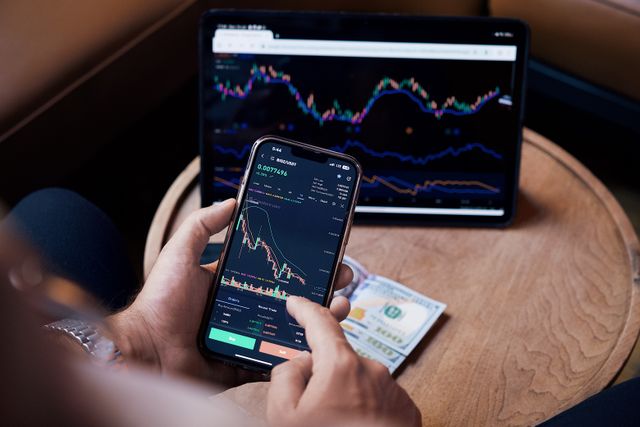
General Investing · The market-timing question, answered
Is It a Bad Time to Invest When the Market Is at an All-Time High?
No — for a long-term investor, an all-time high is not a warning sign. Records have become routine in 2026 (the S&P 500 has already logged more than 20 of them this year), and history shows returns after a record close have matched or beaten returns from an average day. So the real question isn’t whether the market is high. It’s how soon you’ll need the money.
The short version: New records are ordinary — the S&P 500 has set roughly 20 a year on average since 1990, and 2026 alone has already produced more than 20 of them. Historically, investing on a day the market hit an all-time high has matched or beaten investing on an average day. The question that actually decides your answer isn’t “is the market high?” It’s “when do I need this money?”
| Your situation | The honest answer | Why | Your move |
|---|---|---|---|
| You’ll need the money in under 2 years | Probably not stocks | This is a horizon problem, not a timing problem. Short-term money shouldn’t ride market swings. | Keep it in cash-like savings (see the timeline table below). |
| You’ll need it in 3–5 years | Partly, and cautiously | Long enough to lean in a little, short enough that a rough stretch could still bite. | Consider a conservative stock/bond mix rather than all-in equities. |
| You won’t touch it for 10+ years | Yes — the level barely matters | Over long horizons the entry point washes out; time does the heavy lifting. | Invest. The market being high is not a reason to wait. |
| You have a lump sum and you’re scared | Invest it — or ease in — but don’t sit on it | Both approaches beat waiting; the gap between them is small, the gap versus cash is large. | Invest now, or spread it over a few months if that helps you act. |
| You can invest a bit each month | Start now, and automate it | Regular buying sidesteps the “is today the day?” question entirely. | Set an automatic monthly contribution and let it run. |
| You don’t have an emergency fund yet | Build that first | Without a buffer, a surprise expense can force you to sell at the worst possible time. | Fund a few months of essentials, then invest. |
| You’re carrying high-interest debt | Pay that first | Clearing a ~20%+ APR balance is a guaranteed return no market can promise. | Knock out the balance, then redirect that money into investing. |
1. Is Now a Good Time to Invest? The Short Answer
If the money has years to grow, the answer is almost always yes — and the market being near a record is not the reason to hold back. The instinct to wait feels responsible, but it rests on a hidden assumption: that a better price is coming, and that you’ll recognize it when it arrives. History is unkind to both halves of that assumption.
Three ideas do most of the work in this whole article, and they’re worth stating up front:
- All-time highs are normal. They aren’t a warning light. They’re what a market that rises over time looks like from the inside.
- Your time horizon decides the answer — not the market’s level. “When will I need this money?” tells you far more than any headline.
- Waiting has a cost. For a long-term investor, sitting in cash to dodge a possible drop has historically been the riskier move, not the safer one.
The rest of this piece takes your fear seriously — because it’s a real, measured phenomenon, not a character flaw — and then walks through what the data actually shows, and how to move forward without pretending anyone can predict the market. (Spoiler: no one can, and that’s the whole point.)
2. Why Investing at an All-Time High Feels Dangerous (But Usually Isn’t)
Buying at a record feels like walking in at the top of the roller coaster. But records are far more routine than they feel. According to A Wealth of Common Sense (Ben Carlson, July 2025), new all-time highs have happened on average about 20 times a year since 1990. Zoom out further and the pattern holds: since 1950, the S&P 500 has closed at a record on roughly 7% of all trading days. Highs cluster during strong stretches, which is exactly why they arrive in bunches.
Here’s the counterintuitive part. If records were dangerous, returns after them would be worse than average. They haven’t been. In J.P. Morgan Asset Management’s analysis of investing at all-time highs, the average 1-, 3-, and 5-year returns from investing on a record-high day have been as good as or better than investing on any random day.
| Holding period | Avg. return investing at an all-time high | Avg. return investing on any day |
|---|---|---|
| 1 year later | ~14% | ~12% |
| 3 years later | ~46% | ~41% |
| 5 years later | ~82% | ~76% |
Read that table twice. The entry point that feels like “the worst possible time” has, on average, slightly outperformed the typical day over every horizon shown. The honest caveat: one of these record highs will sit right before a painful decline — some always do. We just can’t know in advance which one. That uncertainty isn’t a reason to wait; it’s the reason waiting doesn’t work.
3. 2026 in Context: A Record-Setting Year, Explained
This isn’t just a historical talking point — it’s exactly what has been playing out this year. By mid-2026, the S&P 500 had already notched more than 20 all-time highs, following an even busier stretch of 96 combined record closes across 2024 and 2025, according to market strategist Charlie Bilello of Creative Planning, as reported by The Motley Fool. The index crossed 7,000 for the first time in April 2026 and has kept climbing since, even while absorbing real shocks — an oil-price spike tied to the Iran conflict, stubborn inflation readings, and periodic doubts about the durability of the AI-driven rally.
That combination — records alongside genuine bad news — is worth sitting with, because it’s the normal pattern, not an exception. CNN Business reported that the index still surged roughly 15% in a single quarter this year after briefly sliding on war-related fears, then went on to set additional records days later. A separate Motley Fool analysis noted that investors who bought right before a roughly 9% pullback earlier in 2026 were back to breakeven within about a month — a small, real-time echo of the same pattern the older J.P. Morgan and Vanguard data show over longer stretches.
None of this means 2026’s highs are guaranteed to keep paying off — no single year ever proves the rule either way. What it does show is that “the market is at a record and there’s scary news in the headlines at the same time” isn’t a rare or contradictory state. It’s closer to the default.
4. The Only Question That Actually Matters: Your Time Horizon
If you take one thing from this page, take this: stop asking “is the market high?” and start asking “when do I need this money?” The market’s level is loud and visible; your time horizon is quiet and decisive. It’s the variable that actually determines whether now is a good time for you.
The longer money stays invested, the more the entry point washes out. Over a single year, outcomes are genuinely uncertain — the market has finished down in roughly one year out of four. But stretch the window and the odds transform: historically, 5-year holding periods have been positive about 90% of the time, and the S&P 500 has ended every 20-year period in its history in positive territory — through the 1987 crash, the dot-com bust, and 2008.
So the honest translation of “is now a good time” looks like this:
- Under ~2–3 years: the money arguably shouldn’t be in stocks at all — not because the market is high, but because your horizon is short.
- 10+ years: the current level barely matters. Today’s record will likely look like a minor bump on a long chart.
Notice what just happened: matching your money to your timeline dissolves the timing question entirely. You never had to guess where the market was headed.
5. Why “Waiting for the Dip” Usually Backfires
“I’ll invest when it pulls back” sounds prudent. But it’s a market-timing bet in disguise — and timing the market reliably is something no analyst, model, or professional has been able to do with any consistency. The trouble is mechanical: the market’s best days tend to sit right next to its worst ones, often arriving in the fearful days just after a drop.
There’s a second trap. Because highs cluster, the pullback you’re waiting for may never come at your price. A market that keeps setting records can climb for years while you sit on the sidelines waiting for a discount that never arrives. Even a hypothetical investor with terrible luck — someone who only ever bought at market peaks — has historically still ended up with solid long-run returns, because time compensated for the lousy timing.
If you do have a lump sum and the all-at-once decision feels like too much, spreading it out is a reasonable compromise — just know what you’re trading. Our guide to dollar-cost averaging vs. lump sum investing walks through which one has historically come out ahead and when to choose each.
6. The Fear Is Normal: The Psychology of Investing at Highs
If the statistics haven’t fully calmed you, that’s not a failure of willpower — it’s how humans are wired. In Daniel Kahneman and Amos Tversky’s prospect theory (1979), the pain of a loss is felt roughly twice as intensely as the pleasure of an equal-sized gain. So when you imagine investing $10,000 and watching it drop, the dread is genuinely about double the joy you’d feel watching it rise the same amount. Your fear of buying at the top isn’t irrational. It’s loss aversion doing exactly what it evolved to do.
There’s a second, more specific bias worth naming: recency bias. After a long run of new highs, it’s natural to (wrongly) assume the recent trend — up or down — is more likely to continue than history actually suggests, which is part of why a headline about “record after record” can feel like a countdown to a crash even though the data doesn’t support that reading.
Naming these biases helps. So does a simple tool called regret minimization: instead of asking “what’s the right move?”, ask “which outcome would I regret more?”
This is also why a “mathematically worse” strategy can be the right one for a real human, which brings us to how to actually act.
7. How to Invest Now Without the Fear
The goal isn’t to feel no fear. It’s to build a plan that keeps working whether or not the fear shows up. A few moves do most of that job.
Use dollar-cost averaging as a psychological bridge — with eyes open. Investing a lump sum all at once has historically beaten spreading it out about two-thirds of the time, because markets rise more often than they fall (per Vanguard’s research, “Dollar-Cost Averaging Just Means Taking Risk Later,” 2012, with an average edge of roughly 2 percentage points). So dollar-cost averaging is usually a little worse on paper — but it’s easier to actually do, and it reduces regret. That’s a completely valid reason to use it, even knowing the math. Both approaches beat leaving the money in cash; the enemy isn’t which method you pick, it’s paralysis.
Automate the decision once, so you never have to make it again. Most long-term investors do this through a broad, low-cost fund that owns the whole market. Our guide on how to invest in the S&P 500 covers the mechanics. Set an automatic monthly contribution and the “is today the day?” question simply disappears.
Handle two things before you invest a dollar. Encouraging you to invest comes with conditions, every time:
- An emergency fund first. A cash buffer is what keeps a surprise expense from forcing you to sell investments at the worst moment. Here’s how much emergency fund you really need.
- No high-interest debt. Paying off a card at ~20%+ APR is a guaranteed return the market can’t match. Clear it first.
- A long-enough horizon. If this money is needed within a couple of years, “wait” may genuinely be the right call — for reasons that have nothing to do with the market being high.
If those three are true, the market’s altitude is not a reason to stay out.
8. When Waiting Actually Makes Sense
Being data-driven doesn’t mean being dogmatic. There are real situations where keeping money out of stocks is the smart move — and none of them are about predicting the market.
If you’ll need the money soon, its job is safety and access, not growth. A high-yield savings account, a money market fund, or short-term Treasurys are the appropriate homes for it. (Rates on these move around constantly, so we won’t quote a number — what matters is the type of account, not this week’s yield.) This isn’t market timing. It’s matching the account to the goal’s timeline.
| When you need the money | Where it belongs | Why |
|---|---|---|
| Under 2 years | High-yield savings, money market fund, or short-term Treasurys | The job is safety and quick access — so the market’s level is irrelevant. |
| 3–5 years | A conservative mix (some bonds, some stocks) | Enough growth potential to matter, enough ballast to soften a downturn. |
| 10+ years | Broad-market index funds / stocks | Time smooths out the entry point, so growth becomes the priority. |
So “should I wait?” and “is the market high?” turn out to be two different questions. Wait when your timeline is short. Don’t wait just because the market set a record.
9. What About Gold, Crypto, or Real Estate?
The core principle here — don’t try to time it, match it to your horizon — applies to long-term, broad-market investing generally. But “is now a good time to invest in gold?” or “…in crypto?” or “…in real estate?” are genuinely different questions, because each of those assets behaves differently and carries its own timing considerations, risks, and role in a portfolio. This article can’t give a one-size verdict on them, and it would be dishonest to pretend otherwise.
If that’s what you’re weighing, the dedicated reads are the right place to go: whether gold is a good investment right now, and the practical paths for investing in real estate. For broad-market stocks, though, the answer stays the one you’ve read all the way down: it’s about your horizon, not the headline.
10. Frequently Asked Questions
- Is now a good time to invest in the stock market?
- For money you won’t need for years, historically yes — the market’s level on any given day has told you very little about your long-run return. New highs are normal (about 20 a year since 1990, and more than 20 already in 2026 alone) and returns after them have matched or beaten average days. Just make sure your horizon is long and your basics (emergency fund, no high-interest debt) are covered first.
- Is it bad to invest when the market is at an all-time high?
- History says no. Per J.P. Morgan’s Guide to the Markets, average 1-, 3-, and 5-year returns after investing at a record high have been as good as or better than investing on a random day (1988–2025). One of those highs will eventually precede a downturn — we just can’t know which, which is exactly why timing doesn’t work.
- Why does the market keep hitting record highs in 2026?
- Analysts point to a mix of resilient corporate earnings, continued AI-related capital spending, and shifting expectations around Federal Reserve policy, even as inflation and geopolitical risks (including the Iran conflict) periodically rattle sentiment. The bigger-picture point: frequent records during a strong multi-year stretch are historically normal, not a sign the market is “due” for a crash.
- Should I wait for a market correction before investing?
- Waiting for a dip is itself a market-timing bet, and it usually loses. Highs cluster, so the pullback you’re waiting for may never come at your price while the market keeps climbing. Historically, time in the market has beaten timing it.
- Does timing the market actually work?
- Not reliably — for anyone. The best days sit right next to the worst days: per J.P. Morgan, 7 of the 10 best days over 20 years fell within two weeks of the 10 worst. Miss just a handful and your long-run return can be cut roughly in half.
- Is it too late to start investing in 2026?
- No. “Late” is about your horizon, not the calendar. If your money has 10+ years to work, today’s level barely matters; if it has only a year or two, the issue is the short horizon, not the date.
- Should I invest a lump sum now or spread it out?
- Mathematically, investing it all at once has beaten spreading it out about two-thirds of the time (Vanguard), because markets rise more often than they fall. But dollar-cost averaging can be easier to stick with and reduces regret. Both beat leaving it in cash — pick the one that actually gets you invested.
- What if I invest right before a crash?
- Over a long horizon, it has historically mattered far less than it feels like it should. Every 20-year period in S&P 500 history has ended positive, downturns included. A short-term drop only becomes a permanent loss if you sell — or if you needed the money too soon to begin with.
- How long should I plan to keep money invested?
- As a rule of thumb: money you’ll need within ~2–3 years shouldn’t be in stocks; five years is a reasonable floor for equities; and 10+ years is where the entry point stops mattering much. Historically, 5-year holding periods have been positive about 90% of the time.
- Will I lose my 401(k) if the market crashes?
- A crash lowers your balance on paper, but a 401(k) is long-term money — often decades from withdrawal. Historically, markets have recovered from every downturn given enough time, and steady contributions during a drop buy in at lower prices. The real risk isn’t a crash; it’s panic-selling during one. (No one can predict whether or when a crash is coming — which is why a long horizon, not a forecast, is your protection.)
- Where should I keep money I’ll need soon?
- In something built for safety and access, not growth — a high-yield savings account, a money market fund, or short-term Treasurys. That’s not market timing; it’s matching the account to the goal’s timeline. (Yields change constantly, so focus on the type of account, not this week’s rate.)
- Is now a good time to invest in gold or crypto?
- Those are different questions with different answers. The horizon principle still applies, but each asset carries its own risks and timing considerations — see our dedicated guides. This article is specifically about broad-market stock investing.
This article is for educational and informational purposes only and is not financial or investment advice. It describes historical market patterns, which do not guarantee future results; all investing involves risk, including the possible loss of principal. The statistics cited were verified as of publication from the named sources. Consider your own goals, timeline, and risk tolerance, and consult a qualified financial professional before investing.
RELATED POSTS
View All →



Daniel Hayes is the founder and sole researcher at AdvoraHQ. He covers U.S. personal finance, insurance, and consumer law — working directly from IRS publications, federal and state statutes, court opinions, and SEC filings rather than secondary summaries. His focus is the gap between what readers think they know and what the source documents actually say. Daniel is not a licensed attorney, CPA, or financial advisor; his articles are educational and not personalized advice. Reach him at Daniel.Hayes@advorahq.com.